Key findings
- The outstanding value of all residential mortgage loans was £1,630.5 billion at the end of 2022 Q1, 4.4% higher than a year earlier (Table A).1
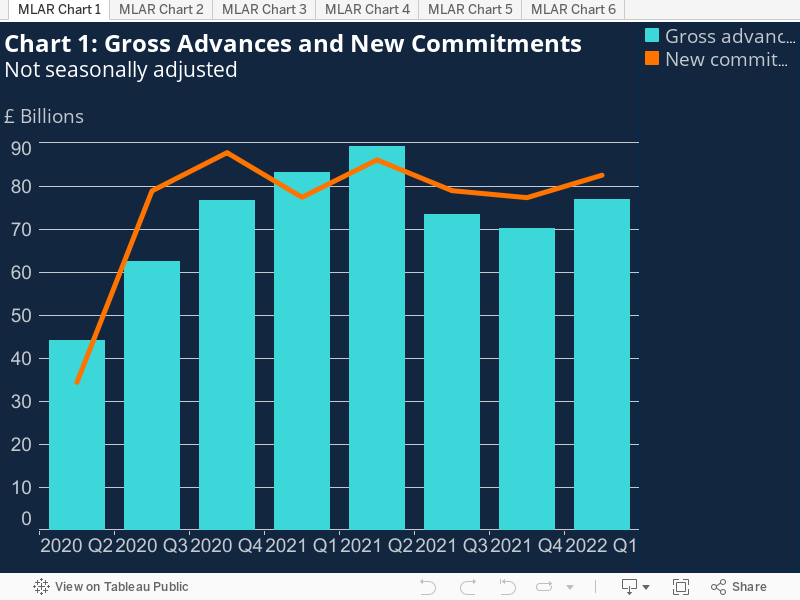
- The value of gross mortgage advances in 2022 Q1 was £76.9 billion, which was £6.7 billion greater than the previous quarter, but 7.5% lower than in 2021 Q1 (Table A and Chart 1).
- The value of new mortgage commitments (lending agreed to be advanced in the coming months) in 2022 Q1 was 6.7% greater than the previous quarter and 6.6% greater than a year earlier, at £82.5 billion (Table A and Chart 1).
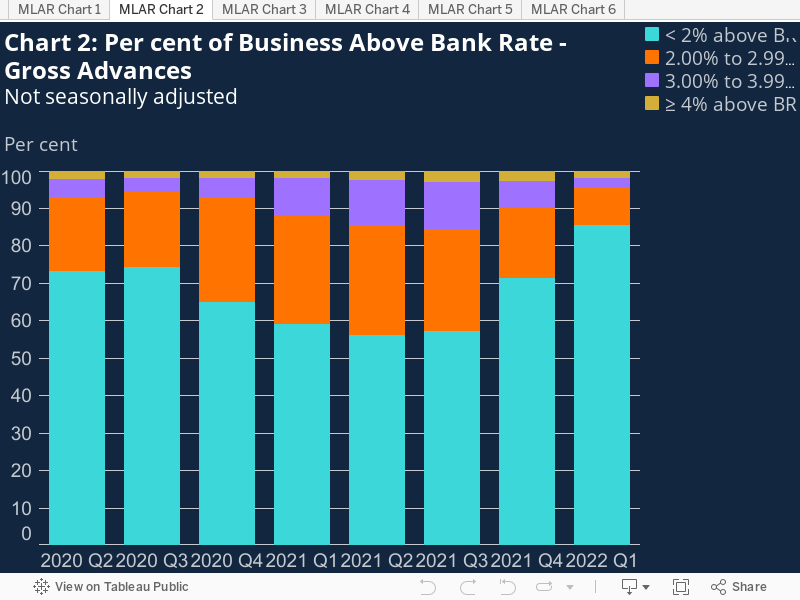
- The share of gross advances with interest rates less than 2% above Bank Rate was 85.5% in 2022 Q1, 26.5 percentage points (pp) higher than a year ago, and the highest seen since 2008 Q3. The increase was mostly driven by the 50 basis points (bp) increase in Bank Rate across the quarter, rather than any significant change in mortgage interest rates (Chart 2).
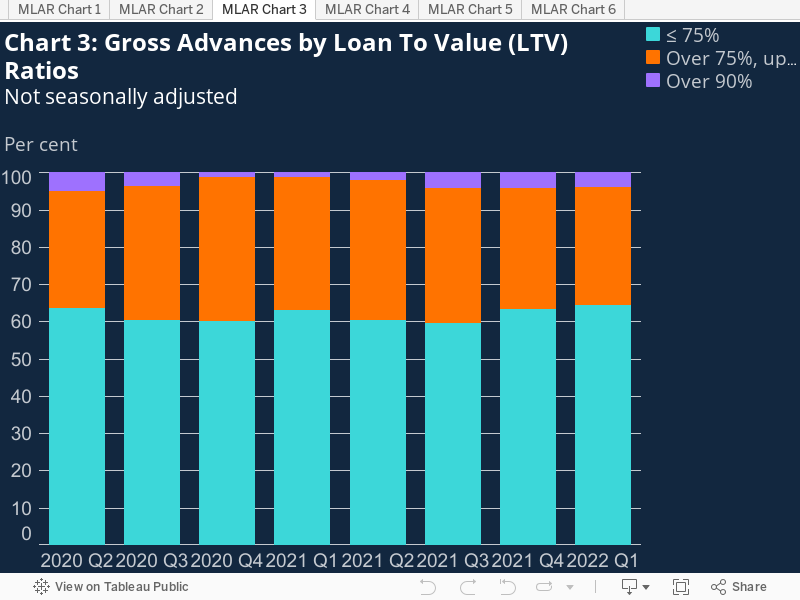
- The share of mortgages advanced in 2022 Q1 with loan to value (LTV) ratios exceeding 90% was 3.9%, 2.8pp higher than a year earlier but a 0.2pp decrease compared to the previous quarter (Chart 3).
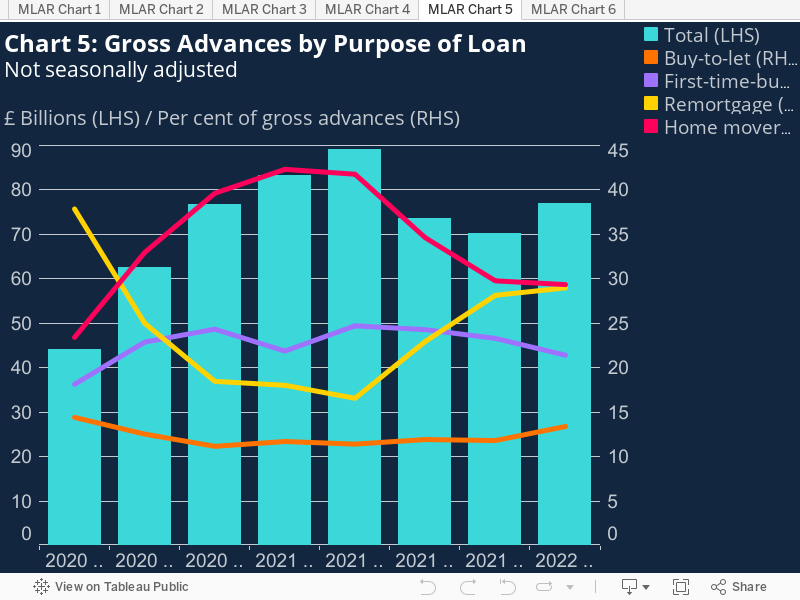
- The share for house purchase for owner occupation was 50.7%, down 2.3pp on the previous quarter, and down 13.4pp from 2021 Q1. The share of gross advances for remortgages for owner occupation was 29.0%, an increase of 11.0pp since 2021 Q1, and an increase of 0.8pp since 2021 Q4 (Chart 5).
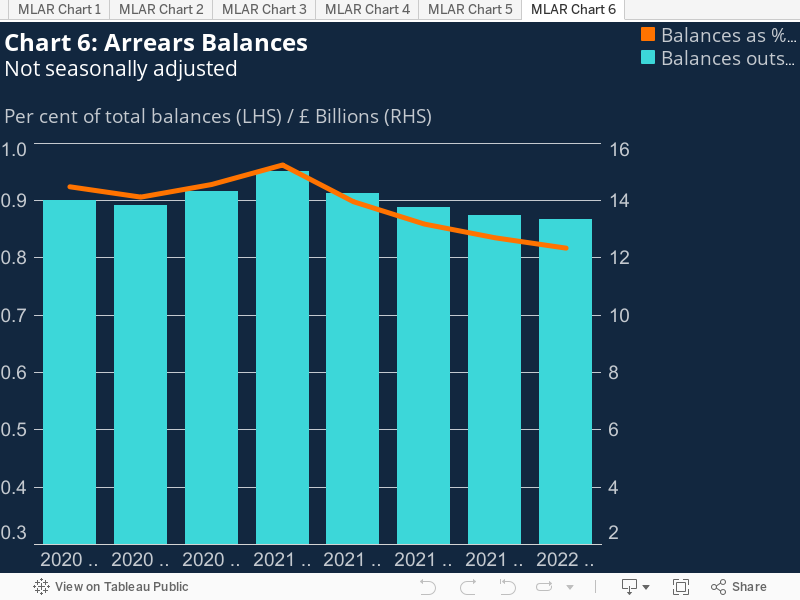
- The value of outstanding balances with arrears decreased by 1.1% over the quarter and 11.3% over the year, to £13.3 billion in 2022 Q1, and now accounts for 0.82% of outstanding mortgage balances, the lowest since recording began in 2007 (Chart 6).
Table A: Residential loans to individuals, flows and balances
Regulated and
non-regulated mortgages *
£ billions
Not
seasonally adjusted
|
Q2 |
Q3 |
Q4 |
Q1 |
Q2 |
Q3 |
Q4 |
Q1 |
|
|---|---|---|---|---|---|---|---|---|
|
2020 |
2021 |
2022 |
||||||
|
Flows |
||||||||
|
Gross advances |
44.2 |
62.5 |
76.6 |
83.2 |
89.1 |
73.4 |
70.2 |
76.9 |
|
New commitments |
34.4 |
78.9 |
87.7 |
77.4 |
86.1 |
78.9 |
77.3 |
82.5 |
|
Amounts outstanding |
1,514.8 |
1,526.0 |
1,541.5 |
1,561.8 |
1,587.6 |
1,601.9 |
1,613.5 |
1,630.5 |
Footnotes
Graphical Analysis:
- The value of gross mortgage advances in 2022 Q1 was £76.9 billion, which was £6.7 billion greater than the previous quarter, but 7.5% lower than in 2021 Q1 (Table A and Chart 1).2
- The value of new mortgage commitments (lending agreed to be advanced in the coming months) in 2022 Q1 was 6.7% greater than the previous quarter and 6.6% greater than a year earlier, at £82.5 billion (Table A and Chart 1).3